From abstract to impact
March 17, 2026
KarbonMap founder and chief executive officer Thanh Hien Mai, who graduated with double majors in Mathematics and Statistics, applies the rigorous patience she learnt proving centuries-old mathematical theorems to a modern problem facing farmers: how to monetise climate impact with technology that turns complex carbon mathematics into practical tools.
Mathematics might seem remote from mangroves and smallholder plots, yet for Hien it shaped the habits that guide her work. “Mathematics training builds my intuition and confidence,” she says, the kind of confidence that accepts false starts as part of progress.
At NUS, her courses courses centred on step-by-step reasoning for results that mathematicians solved only after decades or centuries, so patience and rigour became second nature. That mindset helps when problems are messy, human and environmental, not just abstract. “Sustainability issues are arguably the most challenging problems of our days,” she says. Years of writing and tightening mathematical proofs taught her to persist with the same communities across seasons, and statistics turns that patience into choices that help people today.
Turning probability into practice
Statistics is Hien’s working grammar. Early on, probability, modelling and uncertainty taught her to turn complexity into steps a team can execute. The same discipline runs through KarbonMap: “I have to read a lot of standards and methodology documents and convert them into logical formulas encoded in KarbonMap as an app.” Rigour here isn’t paperwork; it is how results become auditable and comparable across a supply chain.
That discipline becomes practical through Bayesian updating: Think “start with your best sketch, then redraw as evidence arrives”. KarbonMap begins with a sensible estimate for each farm or forest block (the prior). As field teams add soil cores, biomass plots, yield logs and satellite readings, the app updates the estimate (the posterior) and shows where confidence is thin.
With each pass, the picture sharpens, so the next round of work goes where it cuts uncertainty fastest. “In the world of prior and posterior… your observation will slowly update your assumptions,” she says. Hence, the emphasis on ground truth at source and making it easy to record what people see. Once the estimates improve, the next task is reach: putting the same guidance into many hands, in the right language, on patchy networks, all while keeping local fit.
Scale that still fits
Successfully adapting the tool so that it actually works for a specific community instead of forcing a one-size-fits-all setup was a lesson Hien learnt at Google. There, she worked on internationalising Google Assistant (now Gemini). From the outside it looked global; on the inside, it meant steady localisation. “There was the 80 per cent of heavy lifting that the core models were handling, and then there is the last mile that makes the model able to serve international markets.” KarbonMap follows that approach: Build a reusable core once, then tailor the final stretch so tools stay affordable and relevant. On the ground, the team tests options and rolls out what the data supports.
That final stretch is where barriers fall. Custom-hosted language models handle transcription and multilingual interfaces so literacy and language do not exclude users. Flexibility is built in. It could be an offline data-collection tool locals can tailor, automatic checks that flag anomalies or approvals routed through configurable roles because projects differ. The front end stays simple on purpose; the complex work sits behind it. “The user interface and user flow needs to be constantly iterated and simplified… even when no one asks you,” she says. Those design choices only matter if the numbers behind them stand up to scrutiny, which is why the next step is measurement.
Measuring what matters, where it matters
Carbon projects rest on MRV – measurement, reporting and verification – which means gathering evidence carefully enough that others can rely on the result. KarbonMap uses sampling designs familiar from class but demanding in the field. She starts with random pins. When landscapes differ, she uses stratified sampling so each “layer” is represented. Finally, she chooses safer, more accessible points so scarce field hours are not wasted. “We do a lot of sampling… for baseline establishment, for continuous monitoring and evaluation,” Hien says. In practice, it is the same statistical habit: sample more where the margin of error is widest. Once that evidence is collected, it has to flow back to the decision-makers,
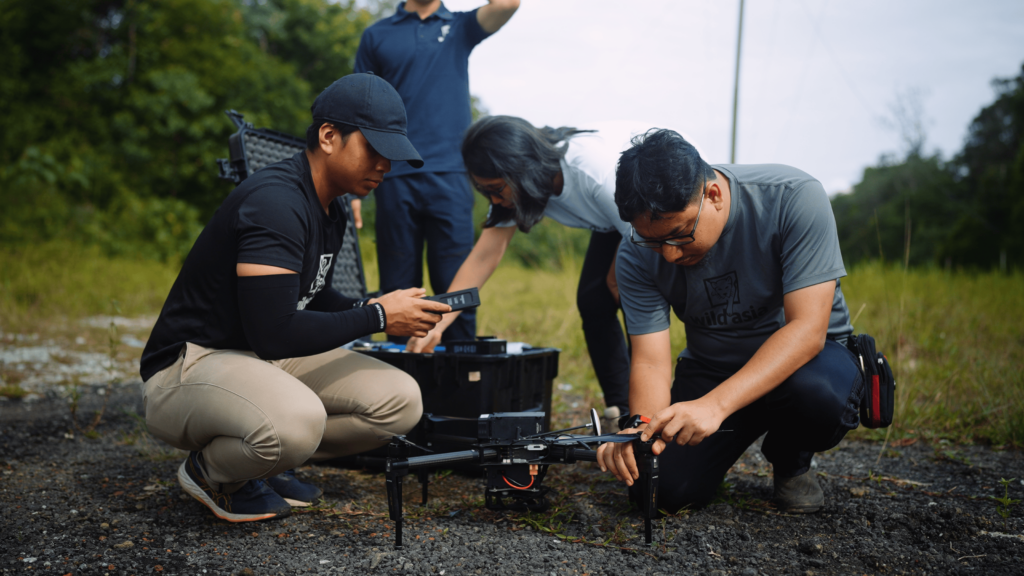
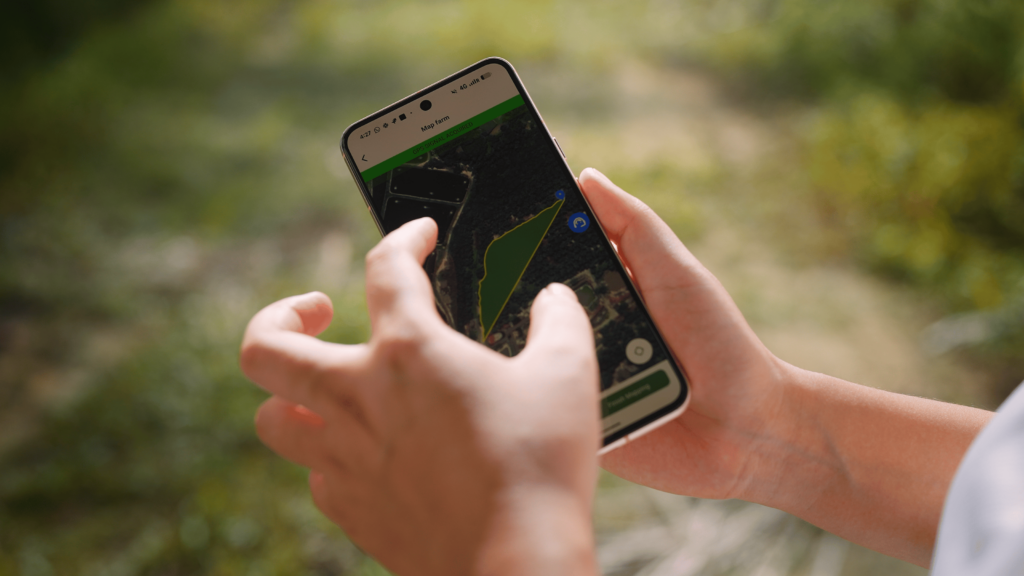
Measurements become decisions once people can act on them. A phone camera with image segmentation and augmented reality sizes real-world objects; satellites sense beyond visible colour, with signals turned into map layers (even) a local youth can use. Together, these tools extend what field teams can see without adding burden to the front end. You see the full chain most clearly in one place.
When maths meets markets
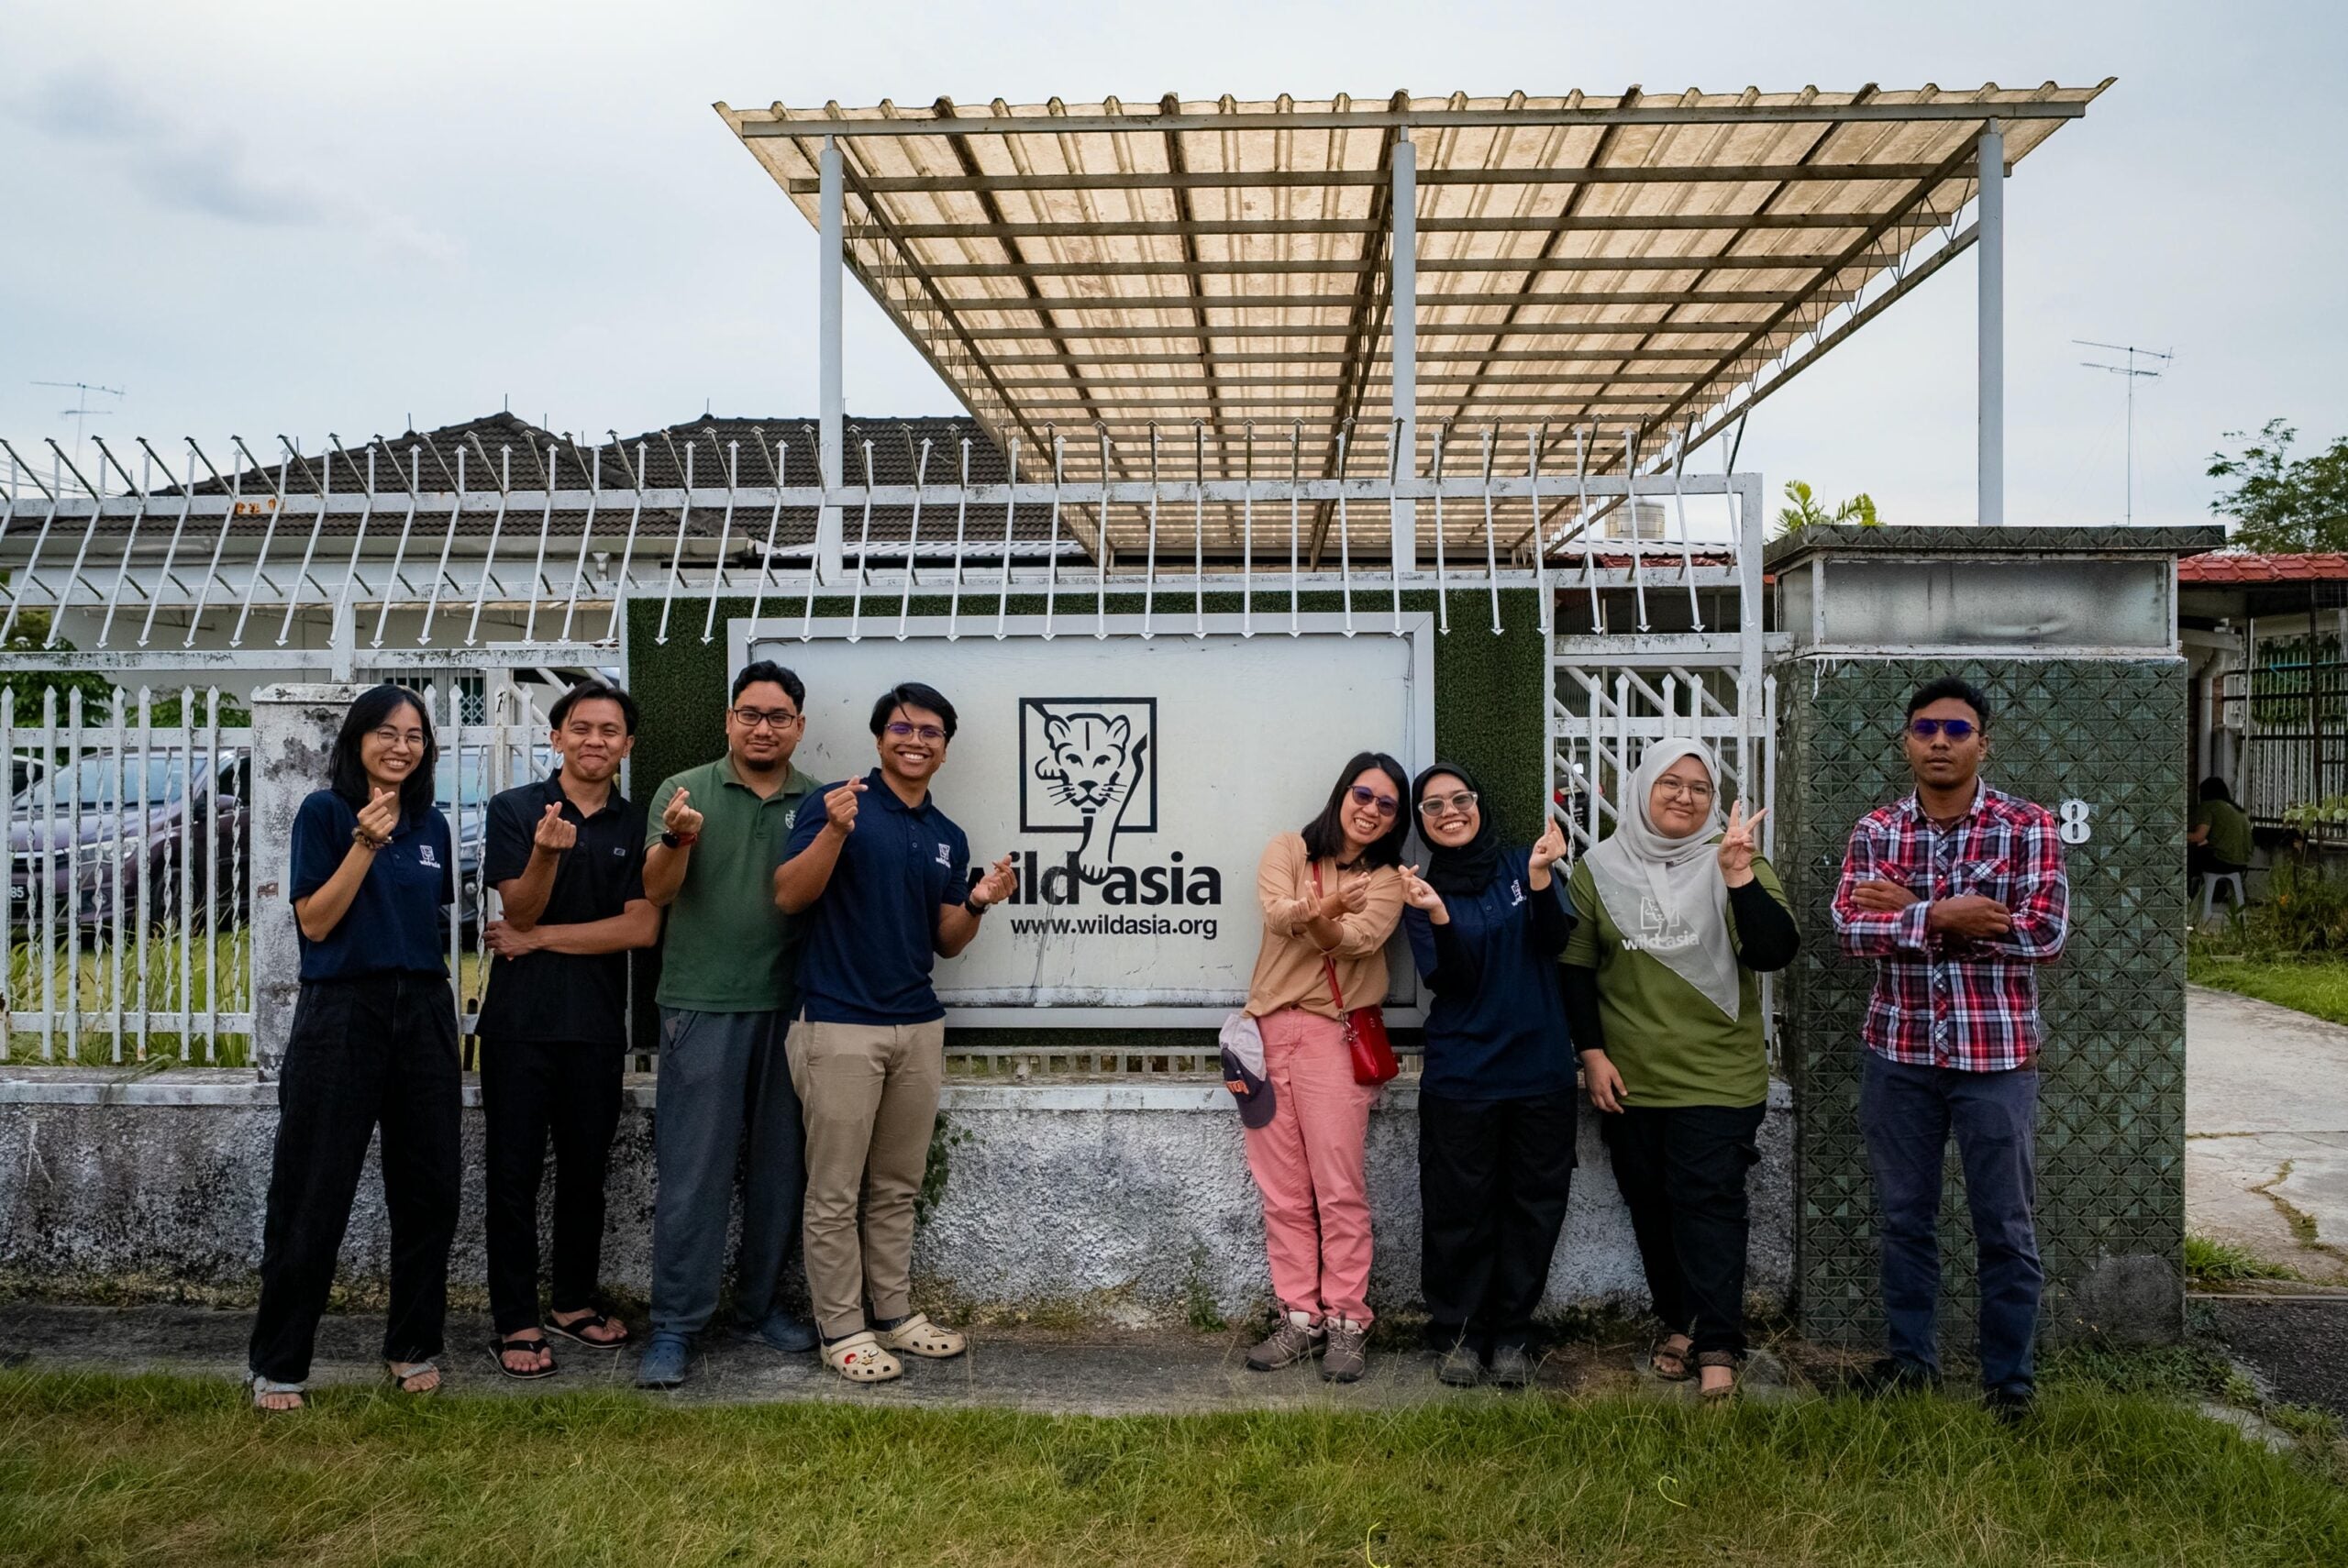
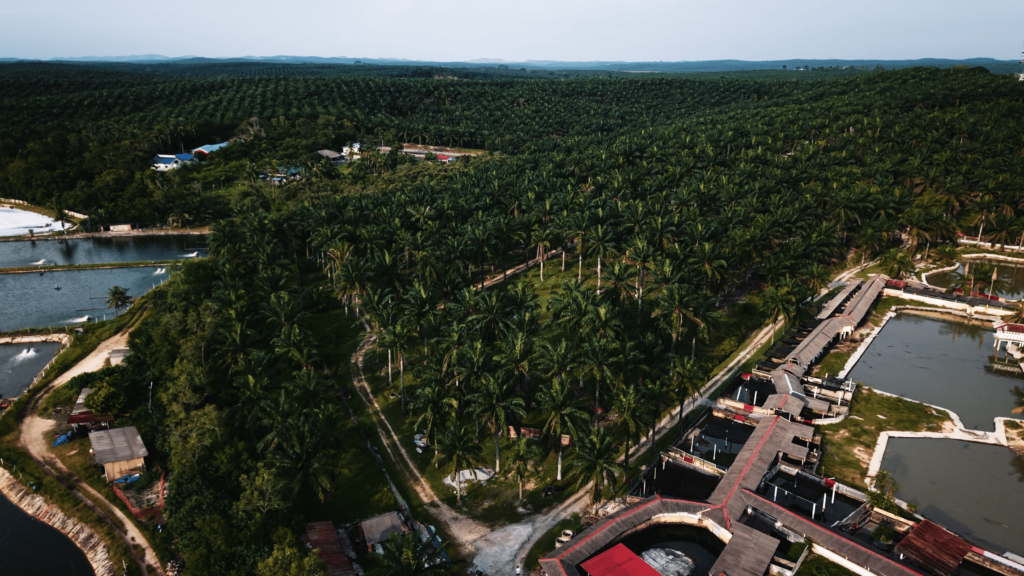
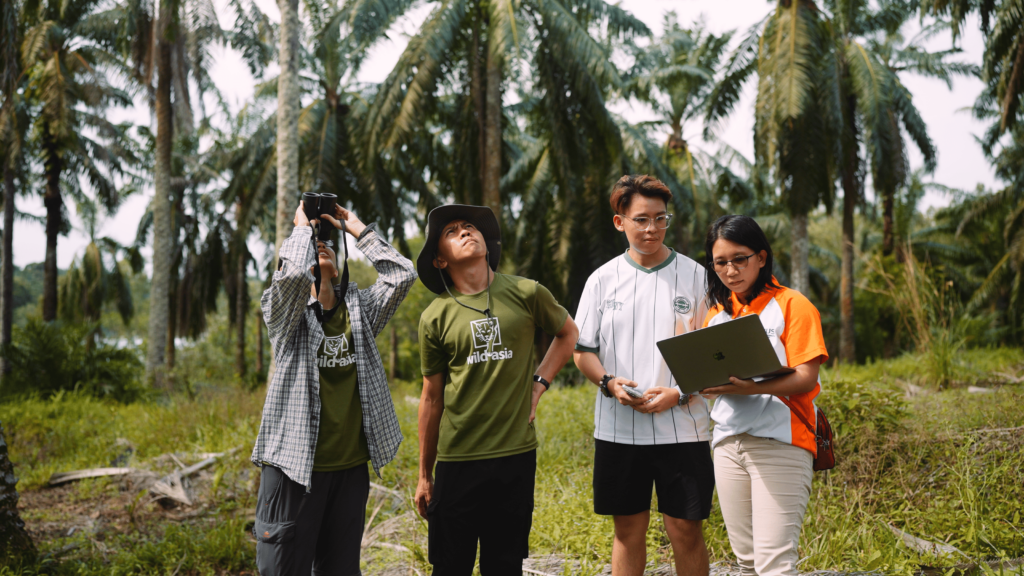
In Sabah, Malaysia, where oil palm has long competed with mangroves and primary forest, KarbonMap supports Wild Asia and smallholders adopting regenerative practices that are raising yields by about 20 per cent on average, reducing spend on fertilisers and chemicals, and opening income from biochar. Group schemes lower certification and audit costs; production and timing are coordinated through Centralised BIO Transformation Units. The net effect is resilience: farms share materials and timing, and mills and overseas buyers enter the same loop.
Keeping those gains steady means holding the line on purpose as well as method. KarbonMap is impact-first, a stance that shapes capital and partners. “What is right and good will survive and thrive in the long term,” Hien says. Not seeking external capital now follows from that view. “There are ups and downs. If we focus too much on individual observations, we will miss the bigger picture we’re moving toward.”