
Strategies to find potential causal genes related to GWAS risk loci using LocusCompare2
November 12, 2025Researchers at the National University of Singapore (NUS) have developed LocusCompare2, an online platform that combines multiple methods for identifying causal genes to better understand the genes that are responsible for certain traits or diseases.
Although genome-wide association studies (GWAS) have identified tens of thousands of genetic regions in our DNA associated with traits and diseases, the functional significance of most of these regions remains unclear. Approximately 90% of these regions are located in “non-coding” parts of the DNA, which do not directly make proteins, so it is not obvious which genes they actually affect. Large-scale initiatives such as GTEx and the eQTL Catalogue have mapped many genetic variants associated with molecular traits and shed light on the regulatory effects of GWAS variants across diverse biological contexts.
To connect these GWAS regions to the actual genes that might be causing the trait or disease, scientists use gene implication methods (GIMs). These are computer-based statistical approaches, and they can be broadly classified into three main categories:
- Variant-level colocalization method – verifies whether the same variant affects both the traits.
- Transcriptome-wide association study (TWAS) – links predicted gene expression to the trait.
- Mendelian randomization (MR) – determines whether changes in gene activity directly cause changes in the trait using genetic variants.
However, previous studies have shown that these approaches often yield inconsistent results, and the majority of GWAS follow-up analyses still rely on a single GIM, which may limit the reliability of their conclusions.
The present study, led by Assistant Professor Boxiang LIU from the Department of Pharmacy and Pharmaceutical Sciences at NUS, systematically examined six widely used GIMs using GWAS data from 36 blood-related traits and GTEx Whole Blood eQTL. The analysis revealed two distinct clusters of methods. The first cluster consists of GIMs using colocalization methods, while the other cluster includes GIMs based on TWAS and MR methods. The outcomes within each cluster tend to agree with each other, but the two clusters often disagreed. Statistical algorithm differences are one of the important reasons for the inconsistency. The research team also found that defining GWAS regions used for gene implication analyses based on linkage disequilibrium (LD), that is, grouping genetic variants that are often inherited together, helped make the results from different GIMs more consistent. However, this approach could also increase the chance of including false positive signals. Choosing the right tissue data was also crucial as using blood tissue data gave very different results from lung tissue data for the same GWAS traits.
The research study was published in the scientific journal Nature Genetics.
Prof Liu said, “LocusCompare2 was developed to facilitate the integration of multiple GIMs and standardise parameter reporting. The platform enables cloud-based execution of all six GIMs, accepts GWAS summary statistics, and provides 280 preloaded tissue datasets spanning diverse biological contexts.”
“Users can flexibly choose from multiple analysis window sizes, select among various tissue datasets and GIM tools, and customize parameter settings according to their research needs,” added Prof Liu.
In short, LocusCompare2 (www.locuscompare2.com) helps researchers avoid the “one method, one answer” trap and instead combine multiple lines of evidence to identify the most likely causal genes behind traits and diseases.
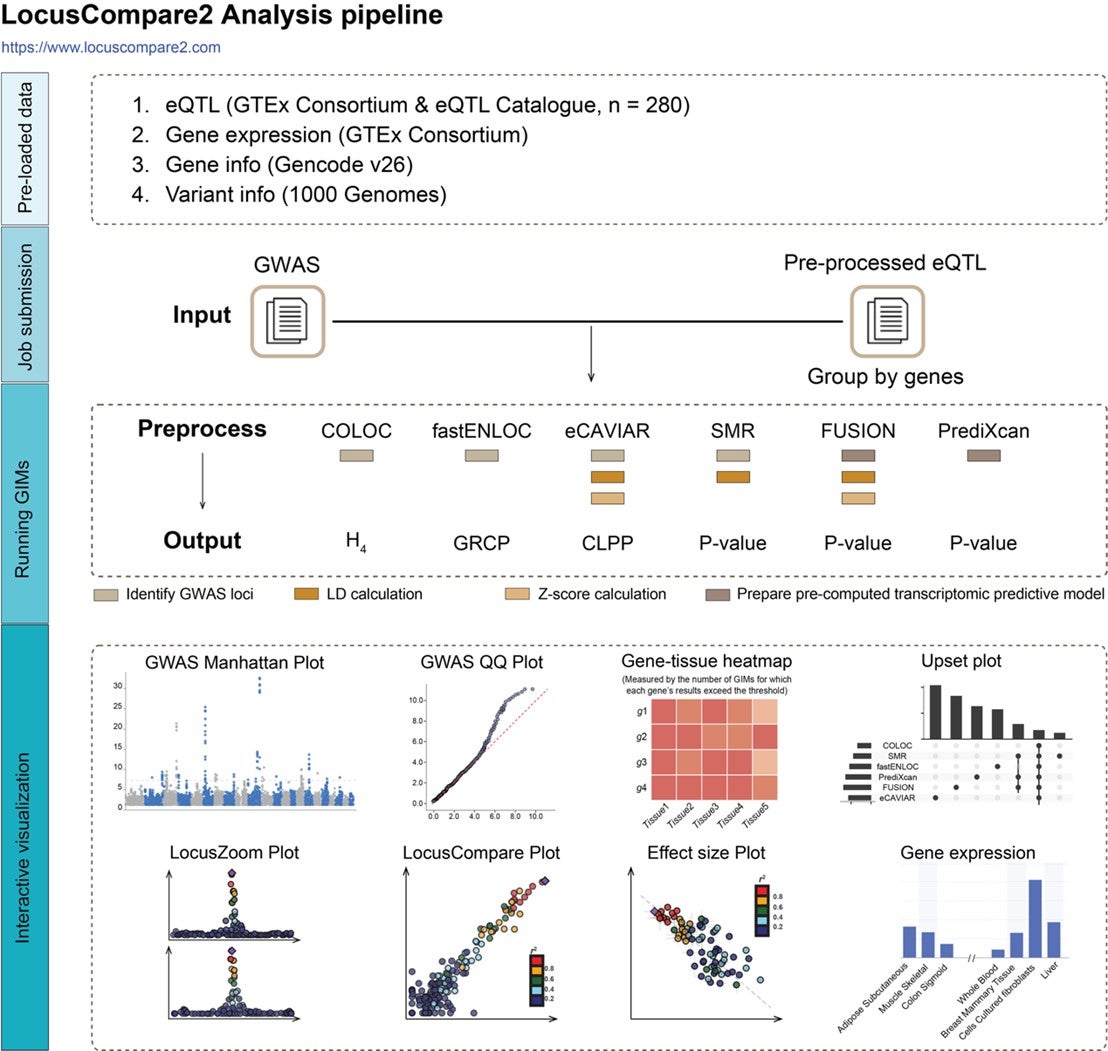
LocusCompare2 (https://www.locuscompare2.com) comes preloaded with 280 eQTL datasets from the GTEx Consortium and the eQTL catalogue, as well as genes and variant information in a MySQL database. The platform accepts GWAS files as input and users can customize parameters such as GIM tool settings, GWAS/eQTL significance thresholds directly on the website. All processing steps are automated, requiring minimal user intervention. Once analyses are complete, LocusCompare2 allows users to explore results across multiple levels, including GWAS, eQTL, GIMs and genes. Additionally, it provides interactive visualisation such as LocusZoom, LocusCompare, and effect size correlation plots to help validate findings.
Reference
Liu F; Gao JB; Lin Y; Meng H; Wang W; Luo Y; Cao Y; Wang W; Guan F; Wang P; Tang J; Im HK; Wen X; Liu B*, “Mitigating inconsistencies in GWAS follow-up analyses with LocusCompare2″ Nature Genetics DOI: 10.1038/s41588-025-02331-x Published: 2025.